As a paleoclimatologist, Erika Wise studies climate trends from the past thousand years. Her methods of inquiry may be complicated — using microscopic crossdating and isotope analysis — but her research begins with something far more common: trees.
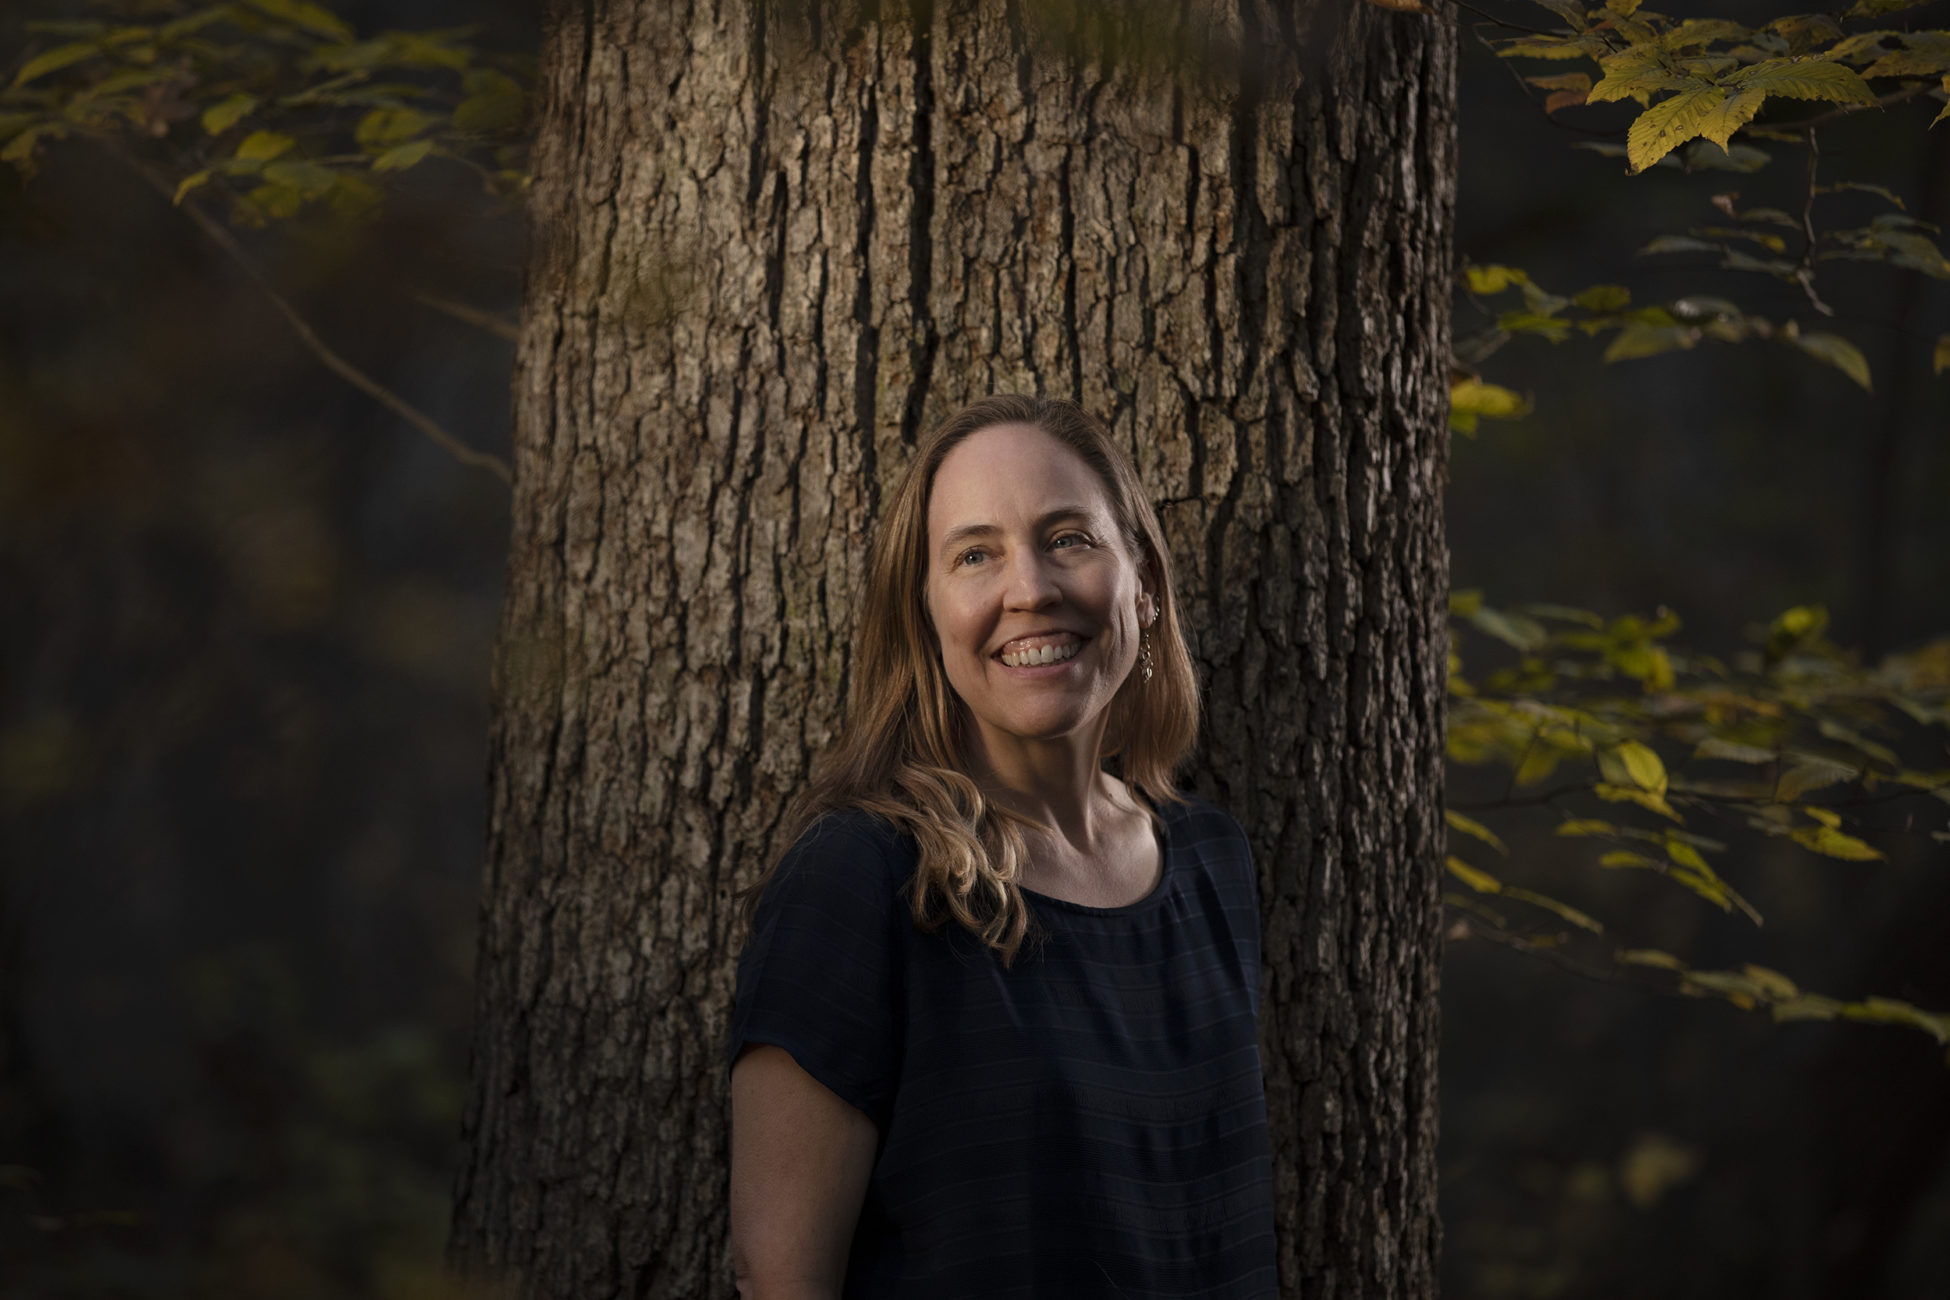
On a shelf in Erika Wise’s office sits a foot-long specimen, only about half a centimeter in width. Marked by alternating shades of rich amber and sepia, this unassuming sample is a tree core and contains about 300 years-worth of data.
Wise studies climate trends from the past millennium through tree-ring science, known as dendrochronology. Paleoclimatologists like Wise use clues in the environment like tree rings, ice cores, and lake sediments to access information about historical trends.
“I think most paleoclimatologists are actually quite interested in future climate change,” she says. “When you want to look at the future we rely on models, and the models can only be calibrated using previous data.”
Over the course of the next century, worldwide temperatures are expected to rise between 2.5 and 10 degrees Fahrenheit, according to the Intergovernmental Panel on Climate Change. These projections are calibrated with historical data gathered by a variety of scientists, including paleoclimatologists.
By focusing on the past, Wise and her peers hope to gain insight on what’s to come.
Reading the trees
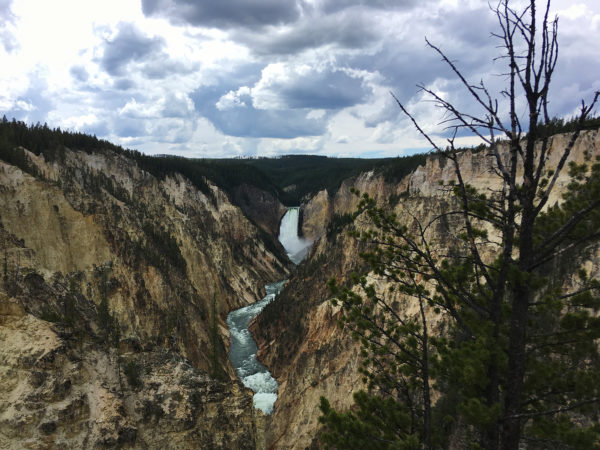
On the crest of a sweeping Wyoming valley, Wise looks down at the gushing Yellowstone River. In the distance, the river surges over a large waterfall before winding its way through the imposing gorge below. Nearby, she finds the perfect cluster of trees. Over the years she has become an expert in spotting old ones – ideal research subjects for her work.
“They just look a bit different. They don’t have the normal, healthy shape of a tree,” she says. “You kind of just get an eye for it.”
Wise slowly drills into the trunk using an increment bore to gather a sample, about the width of a straw. The segment starts at the tree’s outer bark and continues all the way to its center.
Over the course of Wise’s 2-week field work, she will collect about 300 of these specimen, sampling around 150 trees.
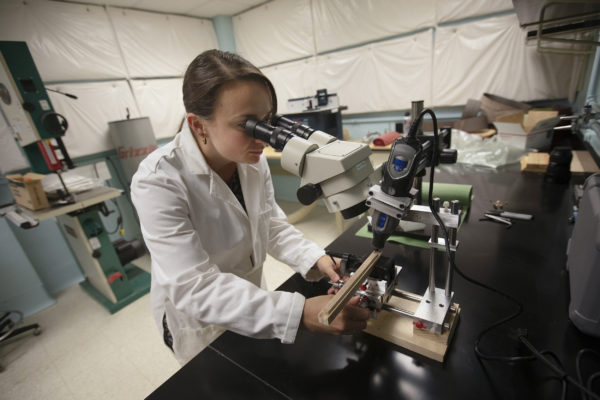
Back in the lab at UNC, her analysis begins.
While an approximate age can be assigned to a tree according to its number of rings, trees can also put on a false ring or grow an incomplete ring during a particularly harsh year. To avoid miscalculation, the cores are microscopically analyzed using crossdating, which matches them to a master record.
“It’s a record of what the narrow rings should look like and you basically end up with a pattern back through time,” Wise says.
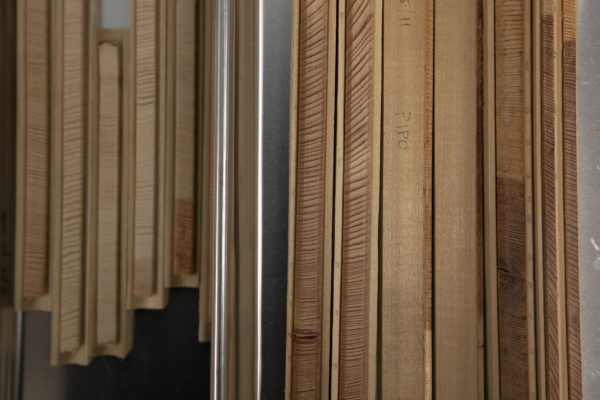
With the tree’s exact age obtained, the researchers dive into analyzing weather trends. They start by measuring ring widths, which correlate with variation in temperature and precipitation. Wise identifies drought by thin rings, meaning the tree’s growth was limited that year.
Methods have recently expanded, uncovering specific seasonal information through analysis of wood density, isotope values, and measurement of the samples’ dark and light variations, called early and late wood.
“There’s been a lot of work to pull out more and more information from what’s stored in the trees,” Wise says. “There’s so much still to learn.”
While substantial information can be obtained from a single sample, Wise wants to cut deeper. She’s looking beyond annual trends to variable seasonal patterns, considering the nuances in climate throughout a year.
“We’re working to get out better seasonal information by some of these new methods, but in general, we have one value a year,” she says. “And that can limit what you actually understand about that year.”
For example, a sample can indicate that, overall, 1725 was a drought year but discrepancies can occur within that year. Although 1725 could have been dry on average, it may have also experienced lots of precipitation in the winter due to unusually abundant snowfall.
To branch out beyond one value per year, Wise partnered with Cary Mock, a colleague at the University of South Carolina. Mock also studies historical climate trends, but approaches the topic through an entirely different method.
Comparing notes
As a historical climatologist, Mock uses human documents — like newspapers, diaries, and shipping records — to study previous patterns.
“Each of these different methods, whether you talk about tree rings or historical records, has strong points and weak points,” Wise says.
While dendrochronology typically only provides one data point per year, written reports used by historical climatologists are more detailed, with some measurements taken multiple times per day. On the other hand, historical climatologists’ information can be limited to where humans live, but dendrochronology’s strength is in the spatial coverage trees provide. By teaming up, Wise and Mock can fill in gaps of their respective records.
The two are analyzing records from West Coast states like Washington, Oregon, and California, between the 1840s and the 1860s — the end of what is known as the Little Ice Age and the beginning of climate change due to human actions.
There’s a distinctive break in the climate at that point, Wise says, characterized by extreme events. Blizzards occurred at odd times, like the one that trapped the Donner party in 1846, and intense periods of drought were followed by heavy floods. In 1861, a 43-day storm left a 300-mile-long mega flood in California’s central valley, devastating the cattle ranching industry.
While the commute from Chapel Hill to the West Coast is long, the region gives Wise particular insight on extreme weather events. Wise is especially interested in climate whiplash — when the weather flips from one end of the spectrum to the other, like a long drought followed by intense flooding.
“A lot of our storm systems come off the Pacific and can affect the whole country,” she says. “And the West is really a place of extremes.”
When Wise began at UNC in 2010, she assumed her research would follow her to the East Coast, but the deeper she went in her studies, the more questions arose. One of these questions pertains to when and why historical and environmental records diverge.
“One thing we’re doing is looking at if the tree ring records and the historical documents disagree, why do they disagree? Is it because the trees aren’t capturing certain seasons that are important?”
Wise and Mock hope by combining their approaches, the two will be able to put together a highly detailed 20-year record of climate on the West Coast, helping lay the foundation of future models.
“I think people all over the world are concerned about these extreme events and wondering if they are becoming more so because of climate change,” Wise says. “The more we know about the parameters of those events in the past allows us to, hopefully, better model them and understand how they might change in the future.”
Post by Megan May, Endeavors