![]() The COVID-19 pandemic — and recession — have profoundly affected the lives of North Carolinians. Our economic future and daily life suddenly changed in March 2020, marking the start of a period of deep uncertainly.
The COVID-19 pandemic — and recession — have profoundly affected the lives of North Carolinians. Our economic future and daily life suddenly changed in March 2020, marking the start of a period of deep uncertainly.
The Carolina Tracker project is an online site offering day-to-day information on how North Carolinians’ lives have changed since the onset of the pandemic. Produced by faculty, staff and students in the department of city and regional planning in UNC-Chapel Hill’s College of Arts & Sciences, the Carolina Tracker presents easy-to-use, publicly-available data for policymakers and North Carolinians to use.
Datasets available at the Carolina Tracker site include:
- Layoffs, labor force participation, and unemployment insurance
- Small business revenue, business closures, office space vacancy and local tax revenue
- Vehicle travel, commuting and personal mobility
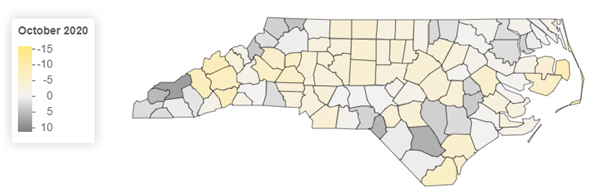
- Evictions, home sales, construction and foreclosure filings
- Childcare, police stops, and air quality.
Visualizing the pandemic’s impact on our lives

Policymakers and the general public can use Carolina Tracker’s visualization tools to investigate changes in trends over time or view maps that show geographic patterns across North Carolina.
North Carolina is a state composed of an incredible fabric of different metros, rural places and cultural regions. In turn, Carolina Tracker’s visualization tool can break down data by different geographic categories.
Stories about North Carolina, from the data
The Carolina Tracker team has also composed a series of data stories, short- and medium-length blogposts meant to help users understand the economic, health and social impacts visible in the Carolina Tracker datasets. For example, sales of large single-family homes have increased during the pandemic, while construction has slowed. What are the implications of these trends for North Carolina homeowners?
Some of the narratives also explore datasets that can’t be easily broken-down by county or region, such as data on domestic violence during the pandemic. Others explore datasets, such as layoffs in North Carolina during the pandemic, that have important nuances that users of the Carolina Tracker can learn more about. Another important concern, highlighted across the different data stories, is how the pandemic and recession have affected different demographic groups. In economic, social and health indicators, there are significant differences in who has been impacted by sheltering in place, economic hardship or the sudden reorganization of daily life. Carolina Tracker has identified important disparities by urban or rural status, race and ethnicity, income and gender.
The Carolina Tracker team
Shortly after the onset of the COVID-19 pandemic, academics and federal policymakers across the United States began to produce important data tracking and visualization tools, mainly comparing different U.S. states. At DCRP, the Carolina Tracker team — led by faculty members Noreen McDonald, Nikhil Kaza and Nichola Lowe — recognized that North Carolina needed a state-specific data tracker. As urban and regional planners, DCRP faculty and students recognize that health systems, local economies and local governments have unique dynamics that cannot be captured at the state level.
DCRP Ph.D. student Xijing Li noted that “On the one hand, it is a useful tool in mirroring the pandemic’s socioeconomic impact from multiple perspectives,” also observing that the Carolina Tracker combined multiple genres of data that are not usually brought together in a single database, such as spatiotemporal data, big data collection and socioeconomic statistics.
Lowe hopes that the Carolina Tracker tool can be used by policymakers to identify potentially vulnerable demographic groups in North Carolina, and in turn “can help inform the design of emergency response systems at the state and county level, helping to protect communities against future health or climate-related threats.”
The Carolina Tracker project was sponsored by the North Carolina Policy Collaboratory at UNC-Chapel Hill, with funding from the North Carolina Coronavirus Relief Fund, appropriated by the North Carolina General Assembly.
By Donald Planey, department of city and regional planning