Scientists analyzed more than 31 million iNaturalist records in a new study to find out who most often uses the popular nature app and what types of observations they submit. iNaturalist allows anyone with a phone or camera and an internet connection to upload and identify photos of plants and animals anywhere in the world.
By examining all available iNaturalist observations from its launch in 2008 through 2019, a team of researchers found users were most active on weekends during the spring and summer months, often in or around urban areas. This was reflected in the types of animals and plants they captured.

“We wanted to know how iNaturalist data is distributed and what biases we need to be aware of when we’re using it to analyze patterns of biodiversity,” said lead author Grace Di Cecco, a doctoral student in biology in the College of Arts & Sciences at the University of North Carolina at Chapel Hill.
Scientists are increasingly tapping into iNaturalist’s massive cache of biological data to take the pulse of a changing planet. Information gleaned from the platform has contributed to more than 1,400 studies.
“We’re able to look at patterns across time and space in ways we never could have done before, like how urbanization affects when plants start producing leaves or the length of the growing season,” said study co-author Robert Guralnick, curator of biodiversity informatics at the Florida Museum of Natural History.
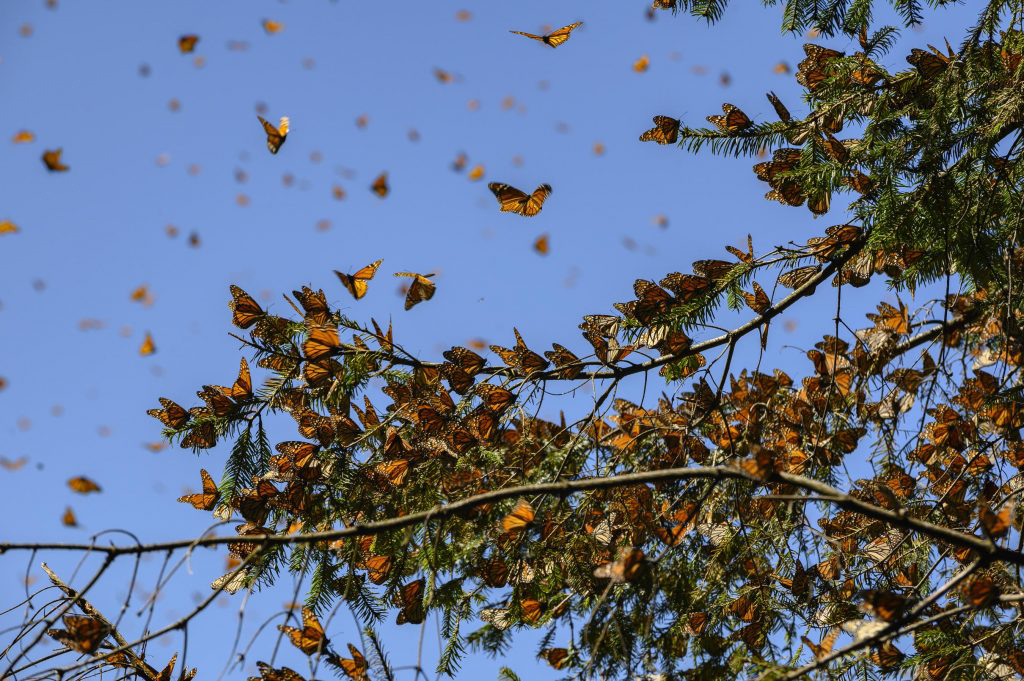
With over 73,000 records, the most observed species on iNaturalist was the monarch butterfly, which regularly passes through urban areas during its annual migration. Western honeybees came in at a close second, with over 70,000 observations. Most of the remaining top 10 finalists were birds, including common favorites such as Canada geese, mallards and red-tailed hawks. The sole mammal to make the list, the eastern gray squirrel, came in 10th place, with just over 40,000 sightings.
“The organisms that do really well in urban areas were the winners,” said co-author Michael Belitz, a doctoral student at the Florida Museum. “Less represented are the habitat specialists in areas that are harder to get to and where there are fewer people to make observations.”
Highly active users primarily posted observations of plants and insects, likely because they’re common in most environments and relatively easy to photograph, said Di Cecco. Large animals, many of which are inactive during the day, were among the least-documented organisms, along with small and fast-flying insects.
There were also stark differences in the number of photos and identifications submitted by users. Just 1% of the more than 1.7 million people with registered iNaturalist accounts uploaded more than 60% of the platform’s observations.
“There are a huge number of people who are involved in iNaturalist, but there is also this core group of dedicated users who are providing tons of really high-quality data,” Di Cecco said.
This isn’t necessarily bad, said senior author Allen Hurlbert, a professor in the department of biology at UNC-Chapel Hill: “If a million people each submit even just one observation, that’s still a bunch of data.”
While the researchers capped their analysis in December 2019, the number of iNaturalist users and observations has continued to skyrocket. Between January 2020 and July of this year, the number of observations more than doubled, jumping from the 31 million records analyzed in this study to more than 78 million.
“iNaturalist has grown exponentially by word-of-mouth because people recognize the power of the global community of expertise and the importance of the data we collectively generate,” said Carrie Seltzer, iNaturalist’s stakeholder engagement strategist.
With so much information at their disposal, researchers are constantly coming up with innovative ways to get the most out of each digital byte, allowing users to directly contribute to and hasten the pace of scientific discovery. Guralnick and his colleagues at the Florida Museum have used iNaturalist data to study how climate change and urbanization affect flowering time in plants and whether their associated pollinators are able to keep pace.
“It’s not just about the individual species or the individual groups like birds, plants or insects. It’s how that all works together,” Guralnick said.
The researchers published their findings in the journal BioScience.
Story courtesy of Jerald Pinson, Florida Museum of Natural History